
212 PnL Charts
Track your Trading 212 returns
212 PnL Charts reads your Trading 212 history with a read-only API key and turns it into charts: what your account is worth against what you've paid in, how each holding has done, and what the same deposits would be worth in an index fund.
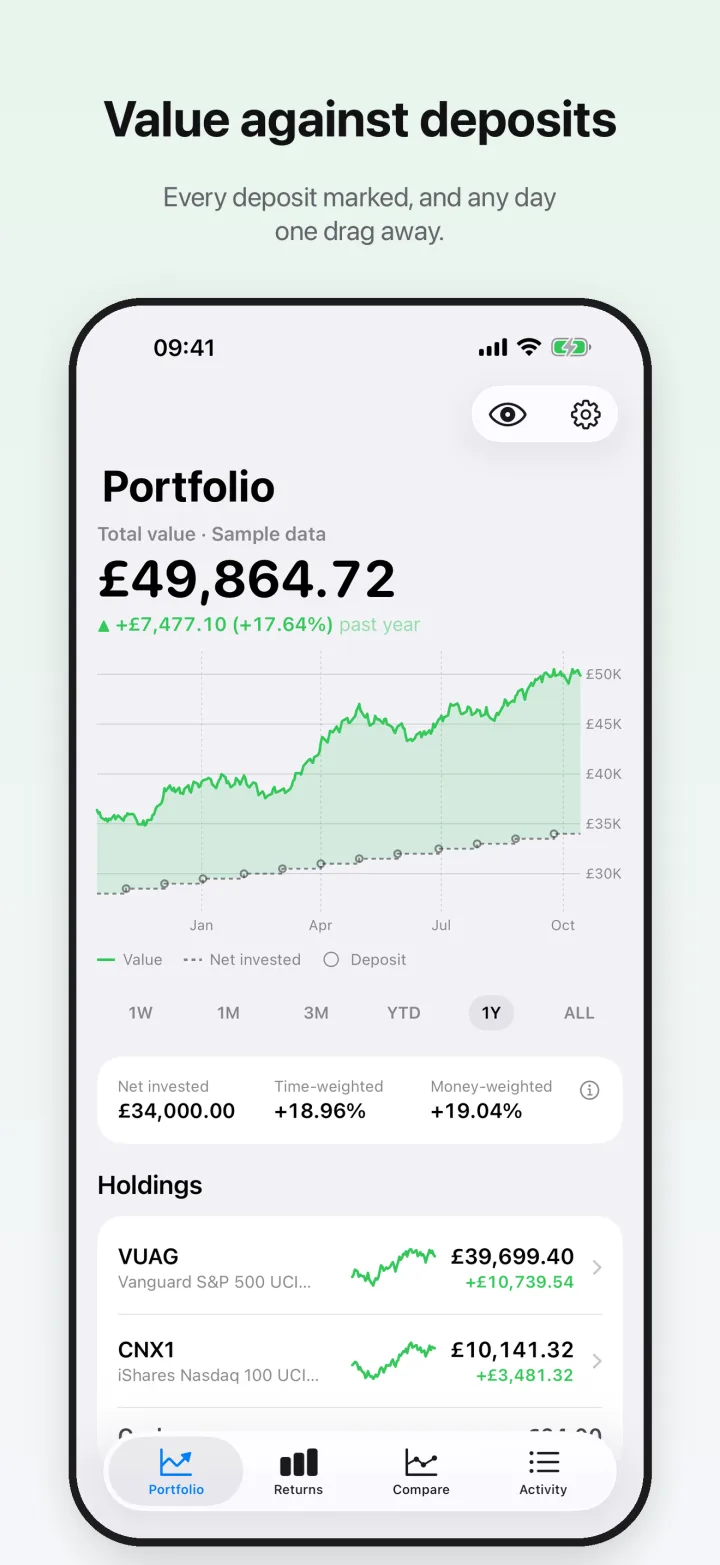
The main chart plots your account's value against net invested, which is what you've paid in less what you've taken out. Each deposit is marked. Drag along the chart to read any day, or drag with two fingers to see the change between two dates.
Unofficial app. Not affiliated with, endorsed by or sponsored by Trading 212.
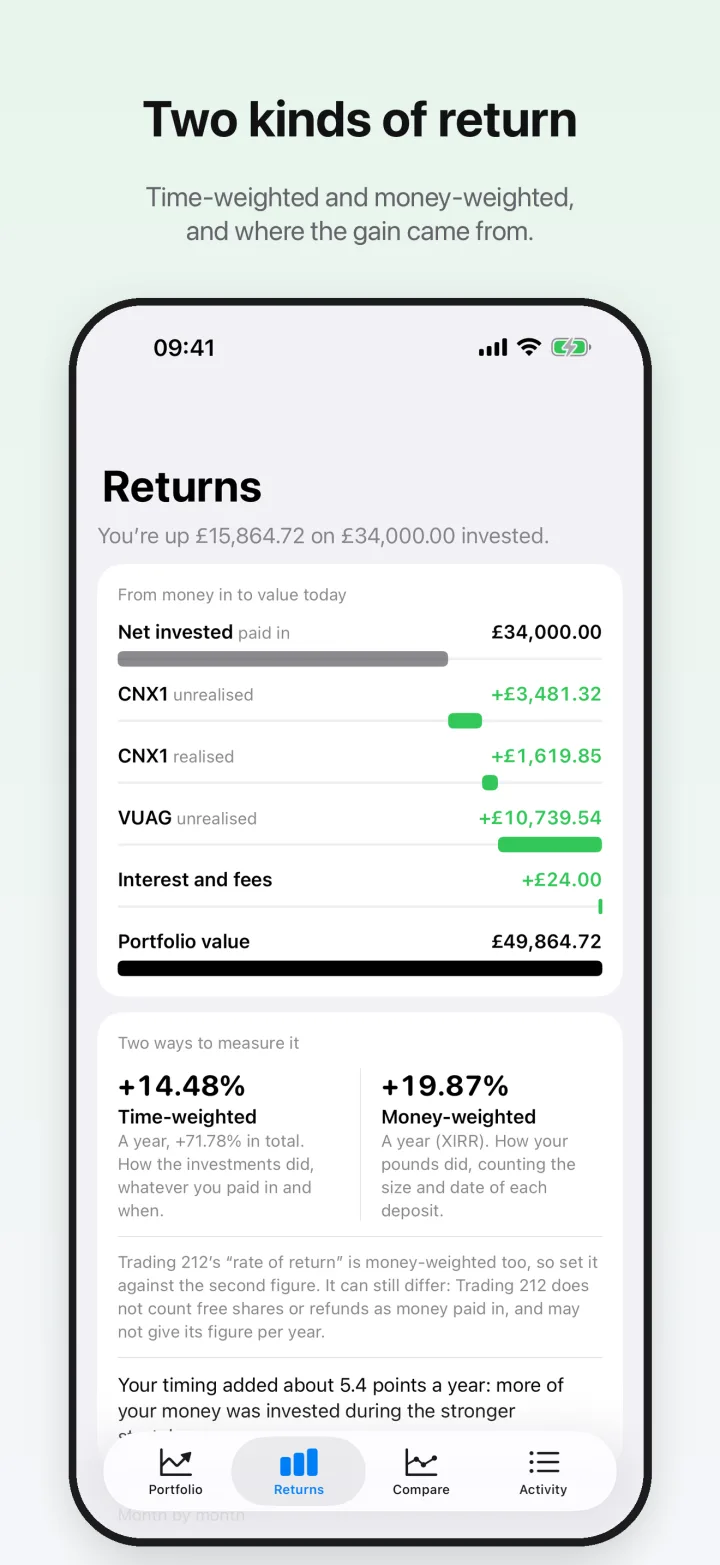
Two kinds of return
Trading 212 gives you one rate of return. The app shows two. Time-weighted return measures how your investments performed, whatever you paid in and when. Money-weighted return (XIRR) also reflects the timing and size of your deposits and withdrawals, so it's closer to how your own money did. Periods under a year are shown in total, not annualised.
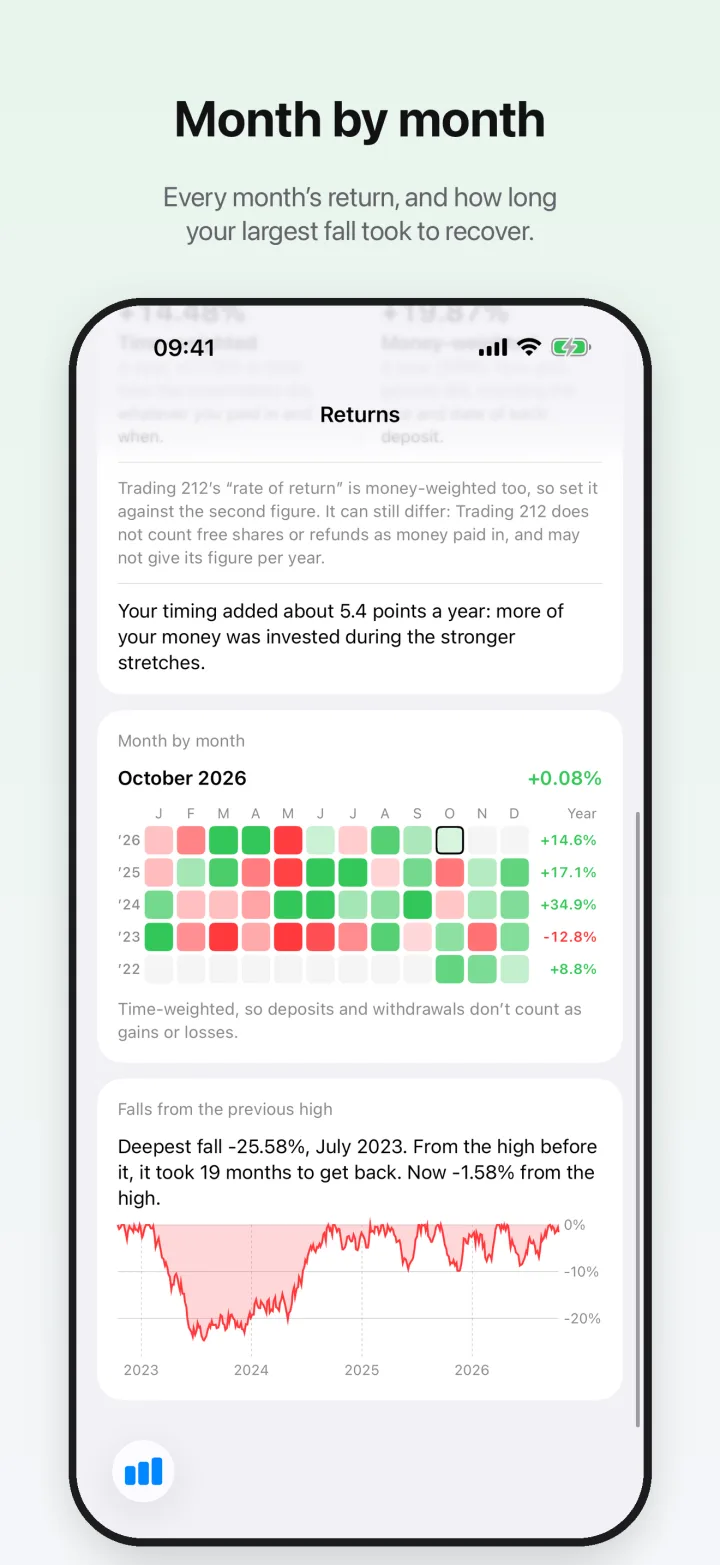
There's also a breakdown from money paid in to today's value, a grid of monthly time-weighted returns, and your largest fall from a peak (maximum drawdown).
How each holding has done
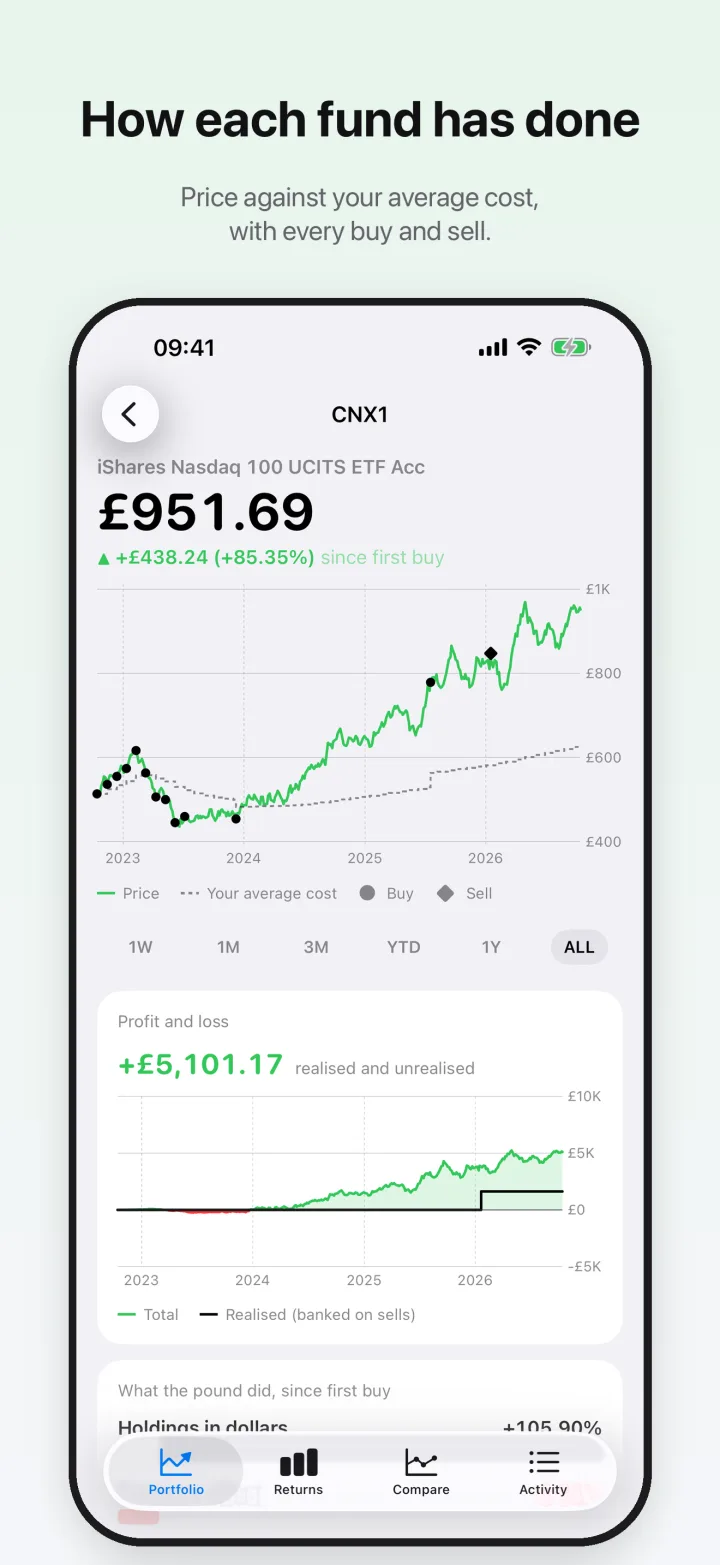
Each holding has its own page, with its price against your average cost and your buys and sells marked. It also shows realised and unrealised profit and loss over time, and how much of the return came from exchange rate movements.
Compared with an index
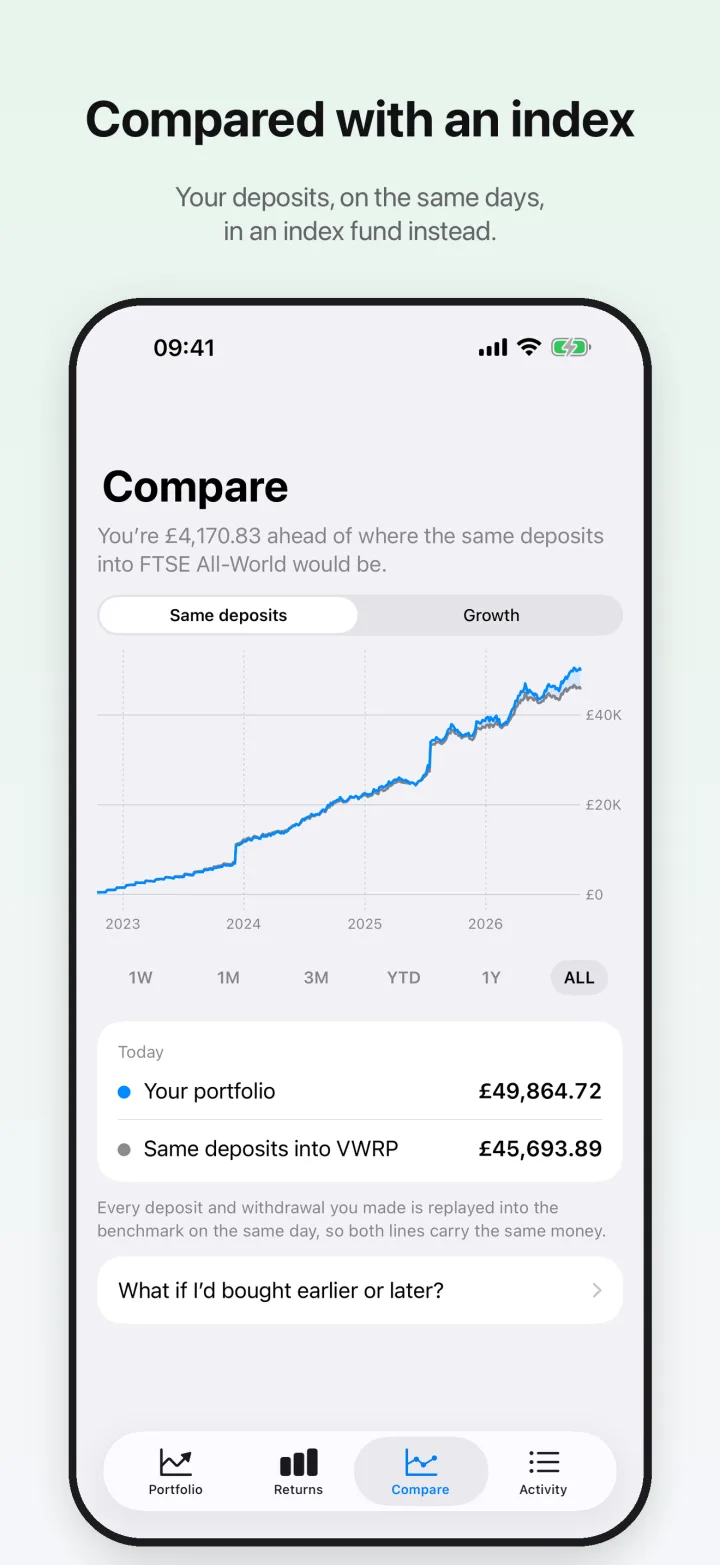
The Compare tab replays your deposits and withdrawals, on the same days, into an accumulating ETF that tracks the FTSE All-World, S&P 500 or Nasdaq-100 (VWRP, VUAG or CNX1). That shows whether holding the tracker instead would have done better.
Buying earlier or later
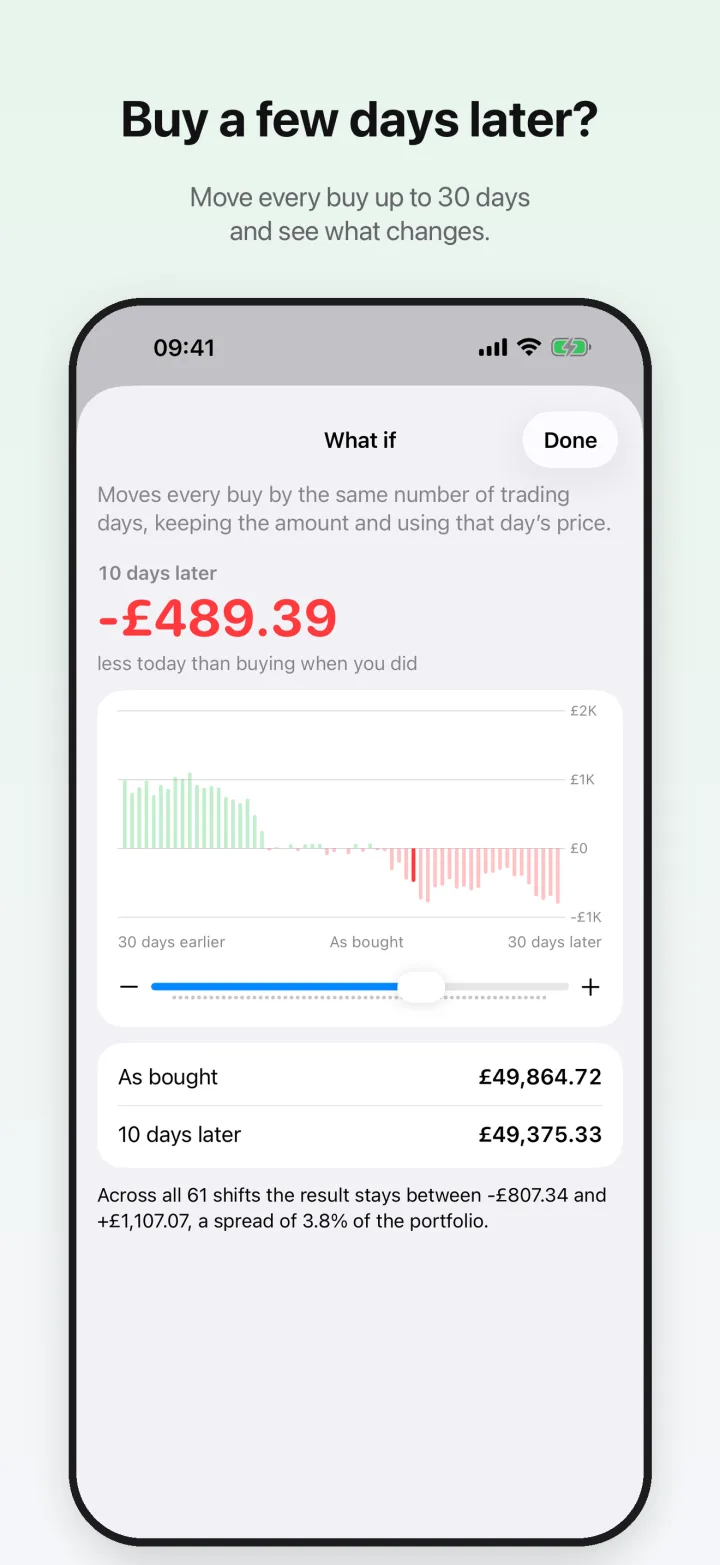
From Compare, What if moves every buy up to 30 trading days earlier or later and shows how that would change today's value.
Stays on your iPhone
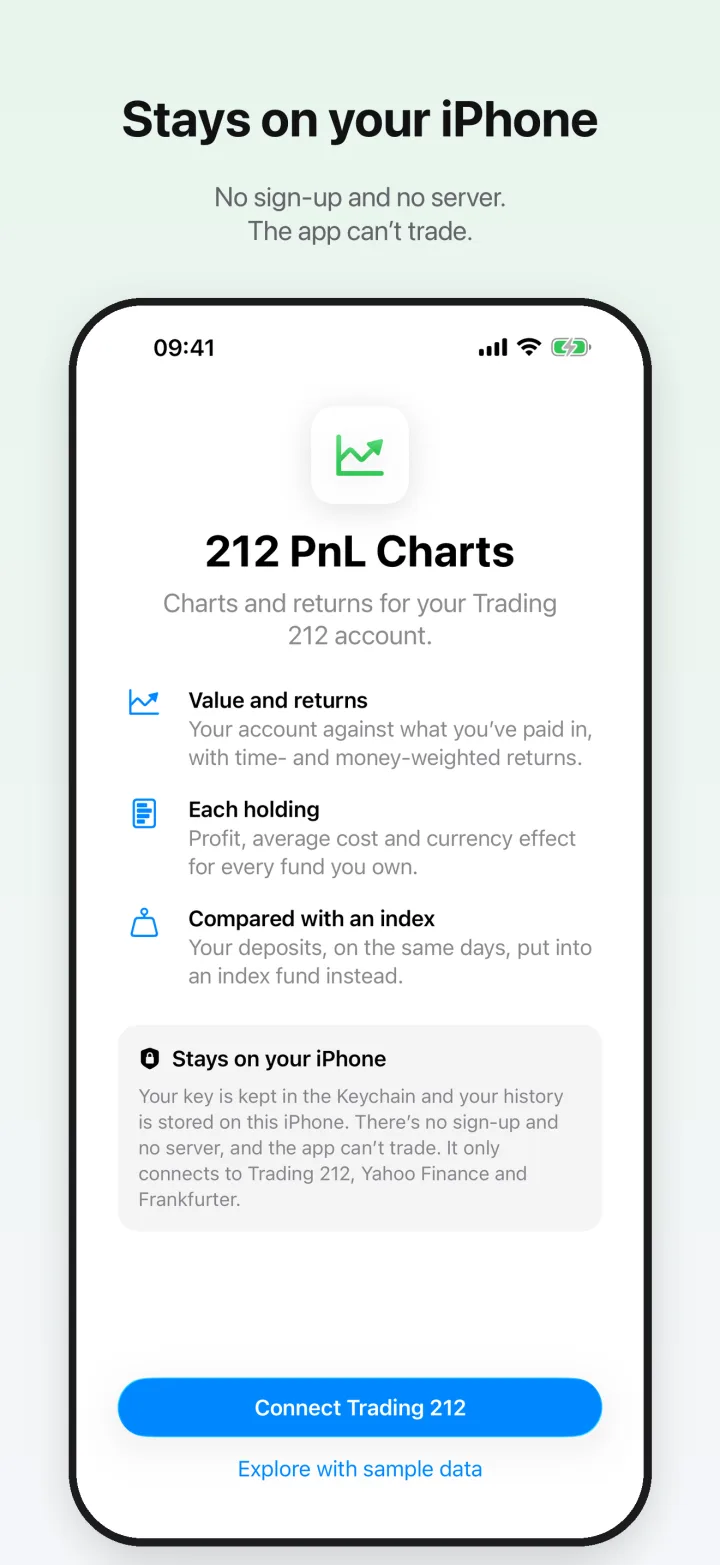
Your API key is kept in the iPhone's Keychain and your data stays on the phone. There's no server. The app can read your account but can't trade or move money.
The eye button hides amounts if you want to show someone your returns but not your balance.
Activity
The Activity tab lists every trade, with the price you paid and how far the price has moved since.
Getting started
Create a read-only API key in the Trading 212 app under Settings › API (Beta) and paste it in. The app shows you where to find it. You can also try everything on a sample account first, without a key.
Accounts, prices and tax
It works with Invest and Stocks ISA accounts. Daily closing prices come from Yahoo Finance, or from EODHD if you add your own key, and exchange rates from Frankfurter.
Average cost follows HMRC's Section 104 pooling but not the same-day or 30-day matching rules, so realised gains may not match your capital gains tax figures. Don't use them for your tax return.